15 Scales and guides
15.1 Exercises
####################################
####################################
# ggplot(mpg, aes(displ)) +
#   scale_y_continuous("Highway mpg") +
#   scale_x_continuous() +
#   geom_point(aes(y = hwy))

# The above can be modified to:
# mpg %>%
#   ggplot(aes(displ, hwy)) +
#   geom_point() +
#   labs(y = "Highway mpg")
####################################
####################################


####################################
####################################
# ggplot(mpg, aes(y = displ, x = class)) +
#   scale_y_continuous("Displacement (l)") +
#   scale_x_discrete("Car type") +
#   scale_x_discrete("Type of car") +
#   scale_colour_discrete() +
#   geom_point(aes(colour = drv)) +
#   scale_colour_discrete("Drive\ntrain")

# The above can be modified to
# mpg %>%
#   ggplot(aes(class, displ)) +
#   geom_point(aes(color = drv)) +
#   labs(x = "Type of car",
#        y = "Displacement (l)",
#        color = "Drive\ntrain")
####################################
####################################
2. What happens if you pair a discrete variable with a continuous scale? What happens if you pair a continuous variable with a discrete scale?
mpg %>%
  ggplot(aes(class, displ)) +
  geom_point(aes(color = drv)) +
  scale_y_discrete() +
  labs(x = "Type of car",
       y = "Displacement (l)",
       color = "Drive\ntrain")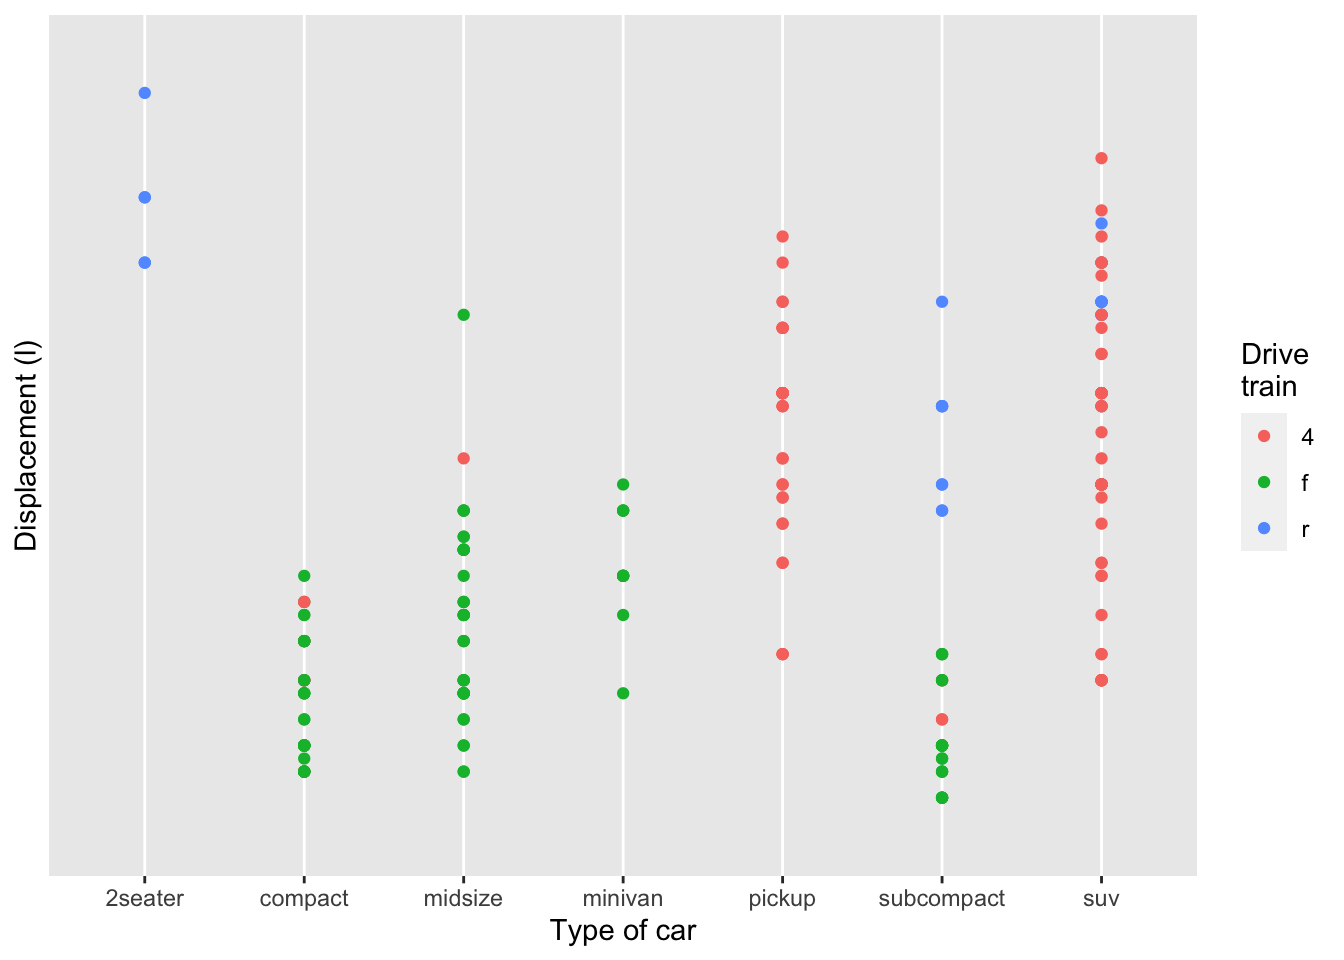
When you pair a discrete variable with a continuous scale, you don’t see a plot and get this error message: Discrete value supplied to continuous scale
When you pair a continuous variable with a discrete scale, as seen above, you get a different looking plot that doesn’t contain the proper axis ticks or grid lines.