3 Individual geoms
3.1 Exercises
1. What geoms would you use to draw each of the following named plots?
- Scatterplot:
geom_point() - Line chart:
geom_line() - Histogram:
geom_histogram() - Bar chart:
geom_bar() - Pie chart: ggplot2 does not have a geom to draw pie charts. One workaround, according to the R Graph Gallery is to build a stacked bar chart with one bar only using the
geom_bar()function and then make it circular withcoord_polar()
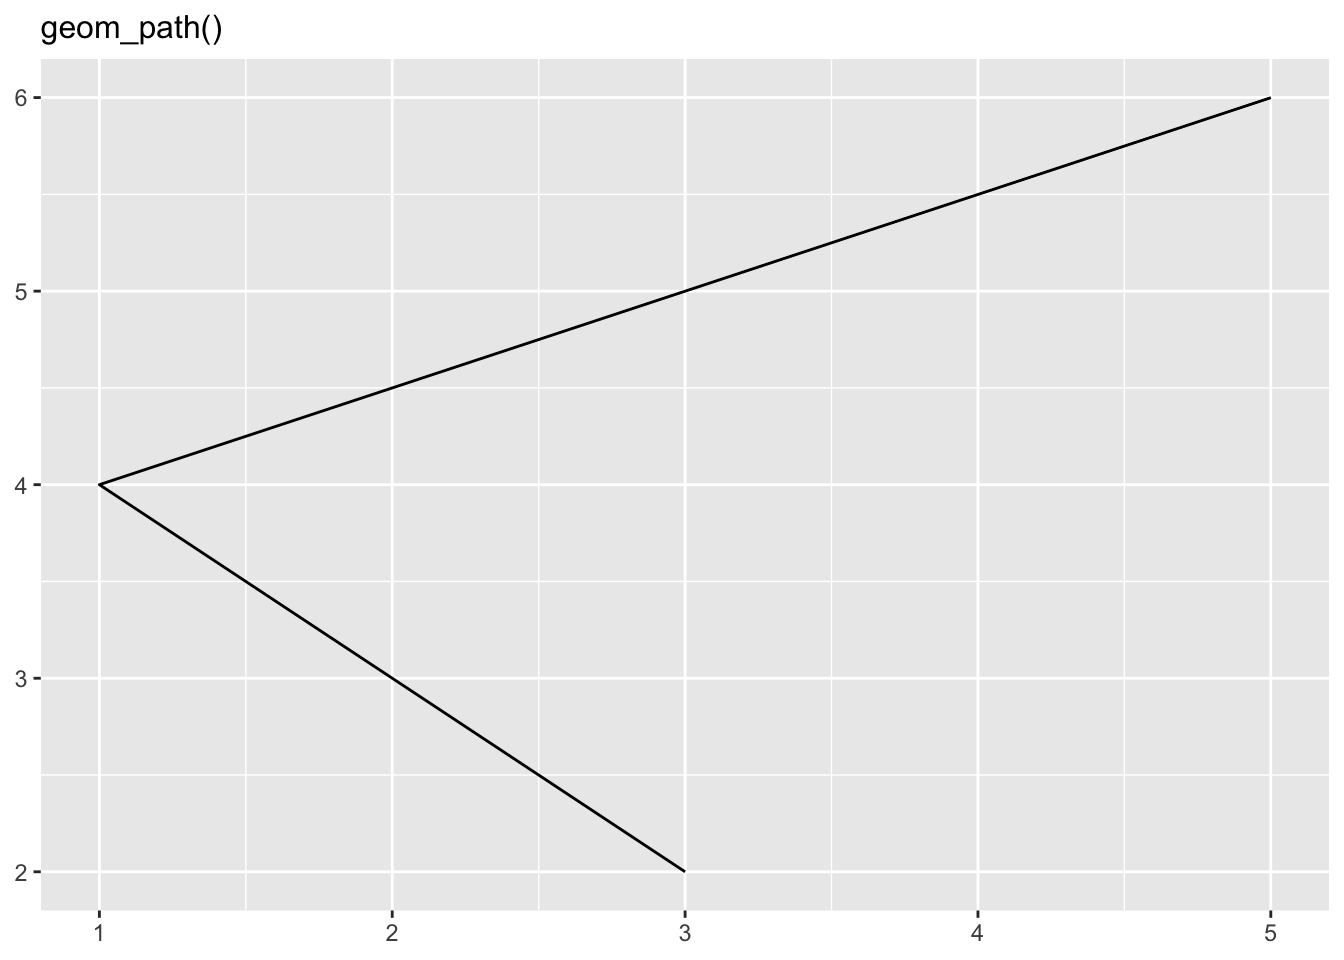
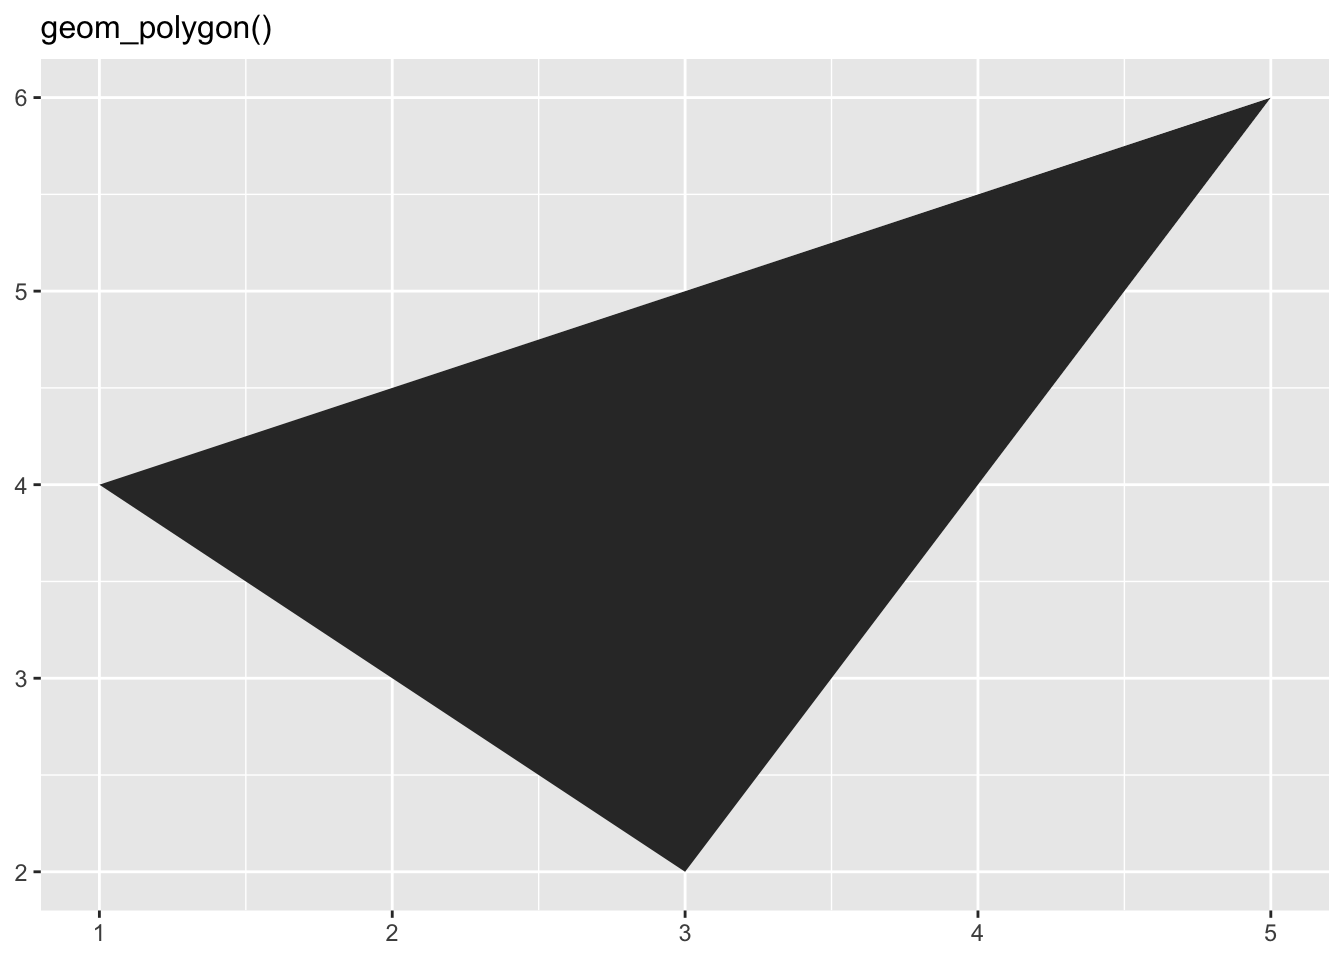
2. What’s the difference between geom_path() and geom_polygon()?
-
geom_polygondraws the same graph (lines) asgeom_path, but it fills these lines with color. See below:
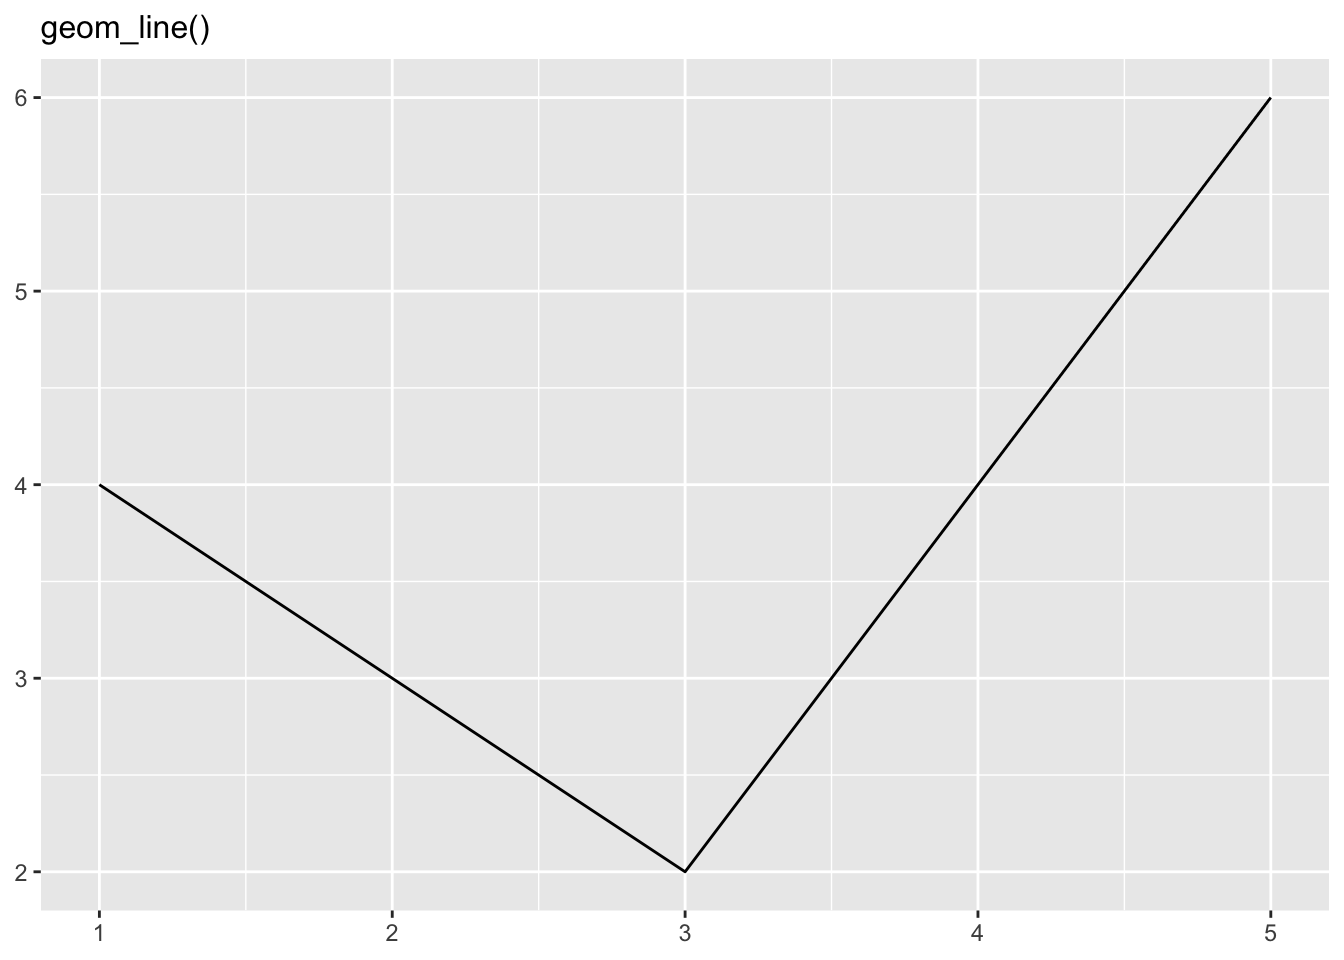
3. What’s the difference between geom_path() and geom_line()
geom_line() connects points from left to right, whereas geom_path() connects points in the order they appear in the data. See below:

4. What low-level geoms are used to draw geom_smooth()? What about geom_boxplot() and geom_violin()?
(kangnade)
-
geom_point(),geom_path(), andgeom_area()are used to drawgeom_smooth(). -
geom_rect(),geom_line(),geom_point()are used forgeom_boxplot(). -
geom_area()andgeom_path()are used forgeom_violin()